Back to Trips & Treats overview
Trips & Treats Subsegments
In this section
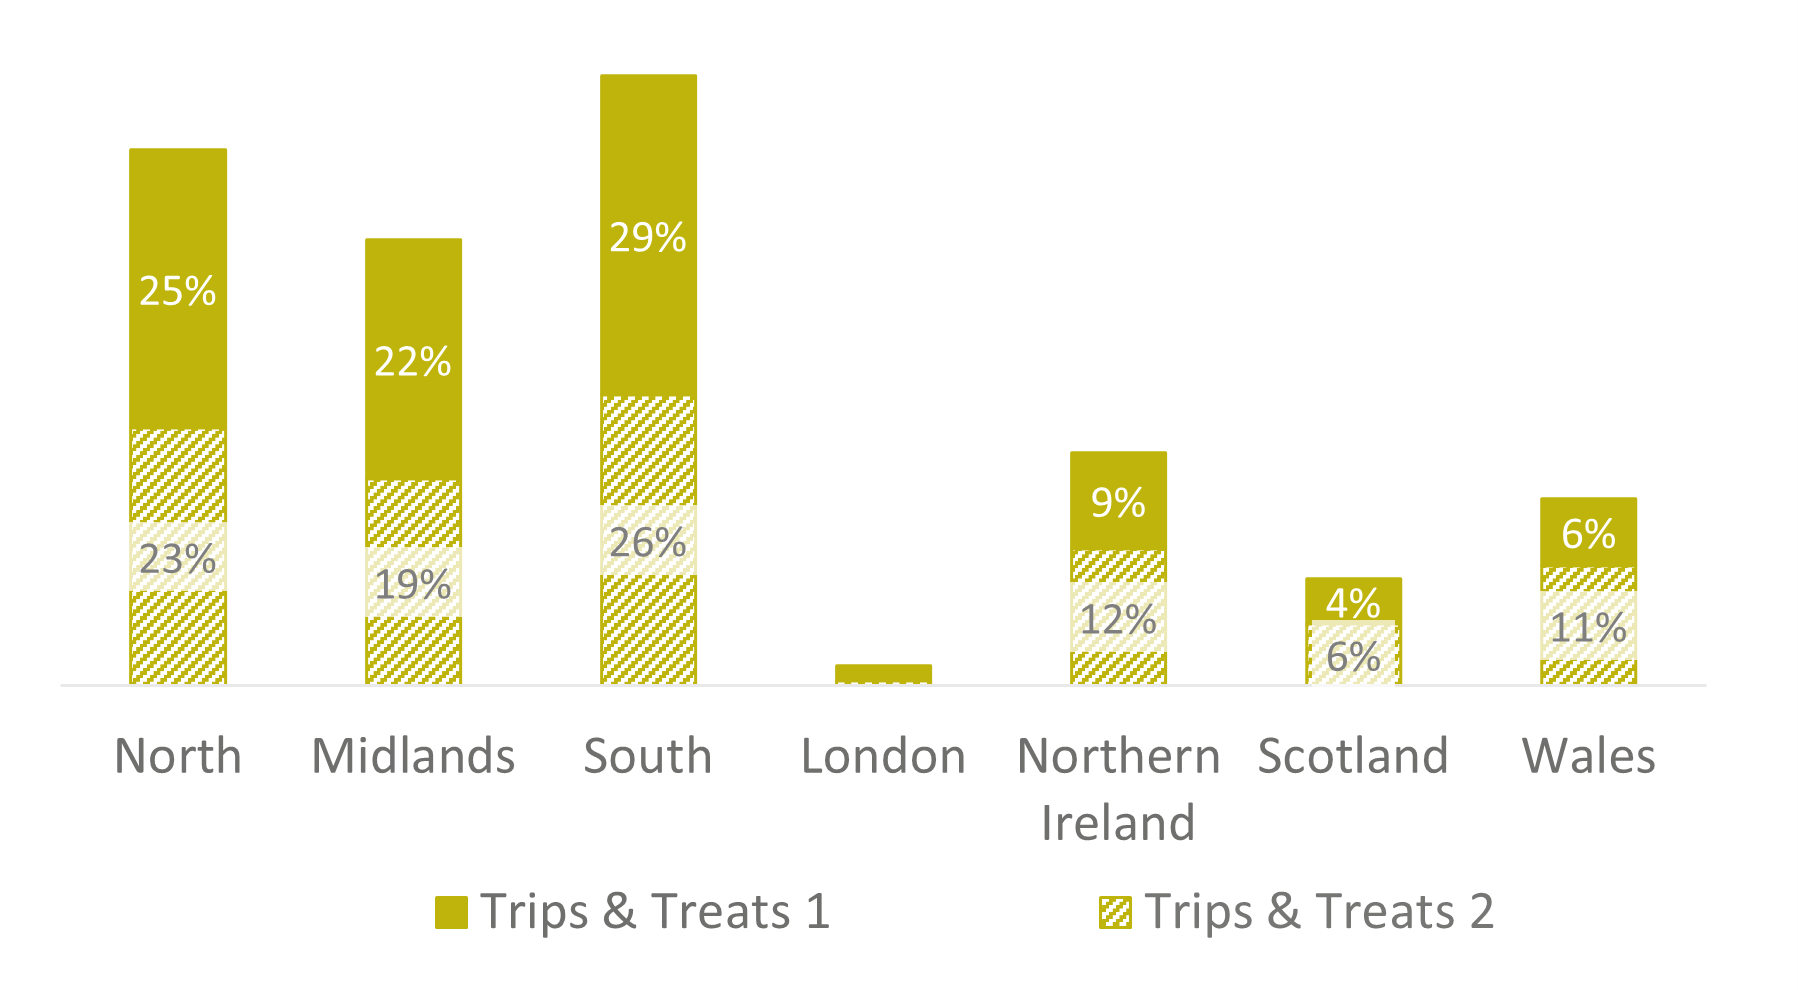
While all Trips and Treats broadly share these core characteristics, closer examination reveals two key subsegments who differ in life stage and style. If your target audience or local area is heavy on Trips and Treats, understanding their variety can help with programming, marketing and outreach.

Trips & Treats | T1
Modern young families, building a future.
- Profiles and Places | These younger families with moderate incomes also live in towns and on the edges of city areas across England, in particular, with higher concentrations in the South East.
- Attitudes and Sectors | They have higher attendance at children and family shows than T2, and are among the most likely subsegments to be attending 'to spend time with friends and family'. This subsegment is open to other mainstream cultural events, but tend not to spend as much as T2.
- Digital and Comms | They make fairly high use of social media - far more than T1s - especially Snapchat, Twitter and Instagram. High Sky subscriptions, as well as to Disney+ and Amazon Music.
Trips & Treats | T2
Settled families with established lifestyles.
- Profiles and Places | Middle-aged families living in 'middle England' towns and the edges of city areas, in particular across England.
- Attitudes and Sectors | They have higher levels of engagement than T1 overall, including of mainstream performing arts events such as music, plays/drama and musical theatre. They also spend more, both overall and per ticket.
- Digital and Comms | They make low use of social media, while a fairly high proportion subscribe to Sky.
